Water - Log(ged)s
About
The project Water - Log(ged)s captures how the rainwater every monsoon becomes an “issue” for the city (Ahmedabad in this case) because of reasons like flooding and waterlogging. By recording different events and data, the project emphasises on how getting rid of rainwater is the only concern that strikes reaction in most cases and nobody really thinks about the potential it could have had, if it was harvested or stored instead of merely just logging the roads and spaces. To delve deeper into the causes and impacts of the same, this project investigates through per day rainfall data over the years, news reports and spatial layouts of relevant infrastructures of the Ahmedabad city to bring forward the correlations.


On this website
you'll find :
The Graphs
These graphs collate widely two things: per day rainfall data for years 2006 to 2020 and waterlogging/flooding news reported on different dates for the respective time period as well. These graphs are a method of comparing and analyzing the situations that led to waterlogging or flooding by overlaying layers of rainfall data alongside the dates of news reports.
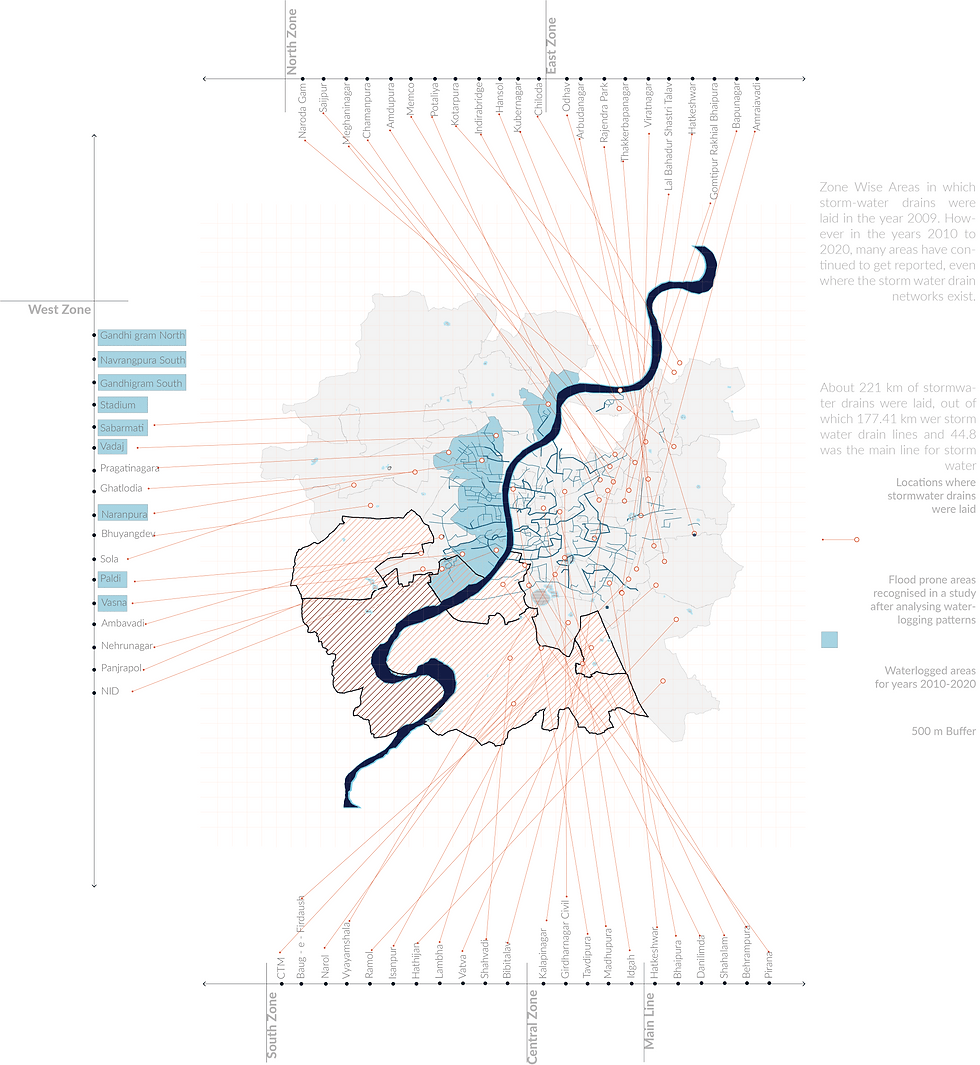
The Maps
The map brings together areas of waterlogging and flooding reported in the news articles over the years 2006 to 2020 with the status of completion of work on different infrastructures (laying storm water drains, disiltation of stormwater drains, laying of drainage networks, lake development projects, etcetera).